Geomapy vs Local Viking: Six Things That Separate Grid Tools
Google reads this search as "geo-grid tools" — and one of the two names is offline. Here's what actually separates grid trackers, and how to price them.
The Six Variables, Up Front
- Search this comparison and Google doesn't return a head-to-head — it returns geo-grid tool roundups. That's a signal about what the search really means: people typing it want a grid tracker, and these two names are just the ones they'd heard of.
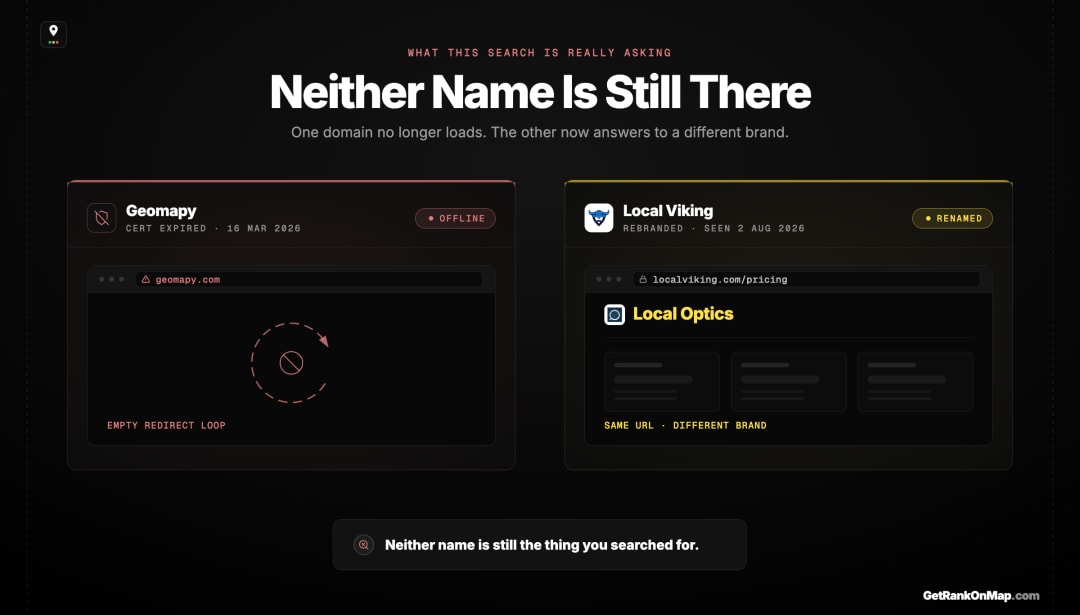
- Geomapy can't currently be reached. Its certificate expired 16 March 2026 and the server returns an empty redirect loop behind the browser warning. We checked on 2 August 2026.
- Local Viking's pricing now renders under the name Local Optics, billed in credits split across two separate pools — keyword credits and GeoGrid credits.
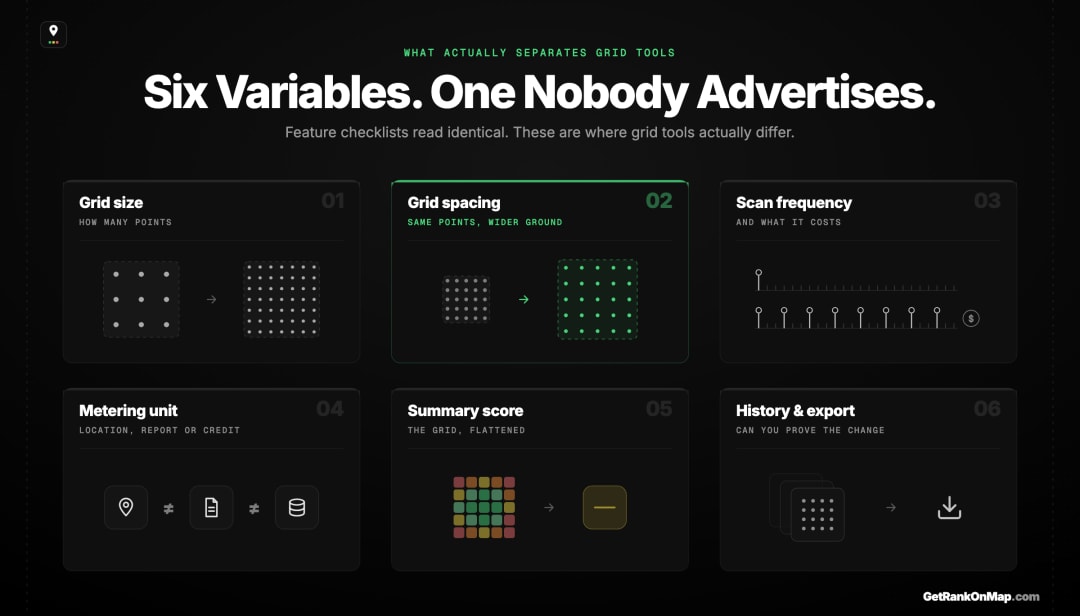
- Six variables decide whether a grid tool fits you: grid size, grid spacing, scan frequency, the metering unit, what the tool aggregates the pins into, and whether history is retained. Feature checklists cover none of them properly.
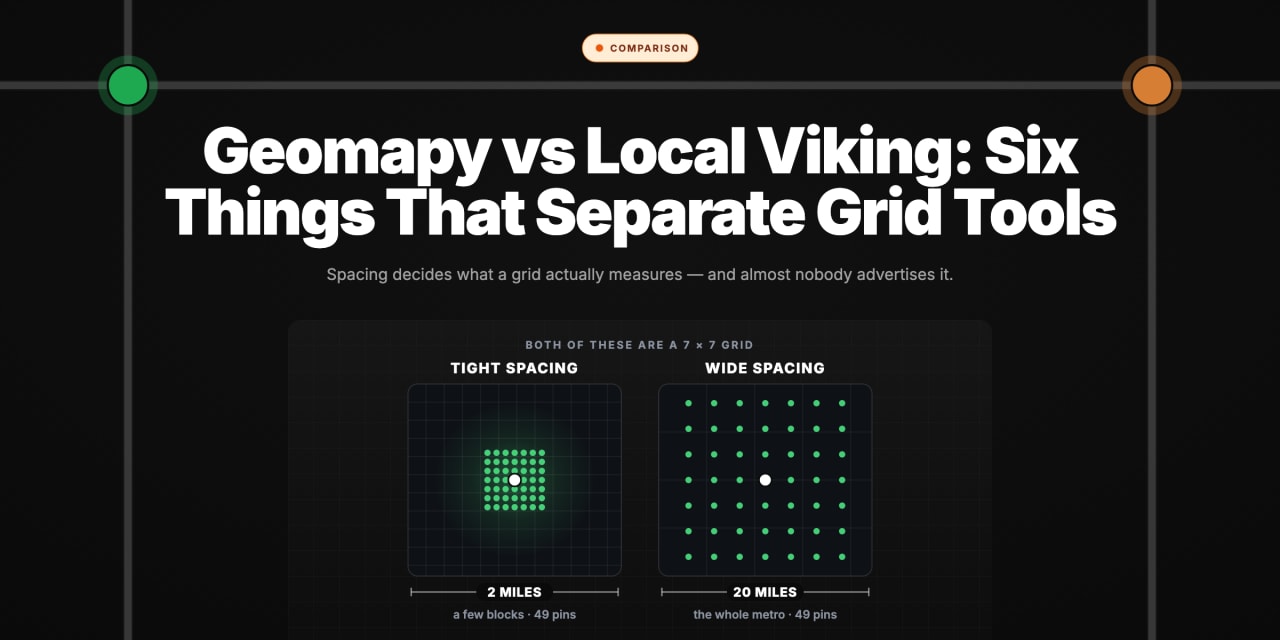
- Grid spacing matters more than grid size and almost nobody advertises it. A 7×7 grid across two miles and a 7×7 across twenty miles are completely different measurements.
What This Search Is Really Asking
Buyers do not experience these as distinct brands. They experience them as one undifferentiated shelf. February 2026:
All these local tools, such as Local Falcon, Viking, Dominator, Whitespark, seem to prioritize the gridding and reporting.
r/localseo, February 2026
Here's something worth noticing before the comparison itself.
Search "geomapy vs local viking" and Google doesn't serve a head-to-head between two products. It serves a page of geo-grid tool roundups — "best geo grid rank tracking tools," "the best geo grid local ranking tools compared," "11 best GMB SEO tools." Google has decided this query means "I want a grid-based rank tracker and I'm using brand names to describe the category."
That reading is almost certainly right, and it changes what a useful article looks like. A feature table pitting two specific products against each other would answer a question you probably weren't asking. So this piece does the thing the search actually wants: it explains what separates grid trackers from each other, using these two as the entry point.
Two pieces of current information first, because they matter to anyone shortlisting from an older article.
Geomapy is not reachable. As of 2 August 2026, geomapy.com serves a TLS certificate that expired on 16 March 2026 — which makes every modern browser block the page outright — and bypassing that warning produces a redirect to /index.php with a zero-byte response. There's no page behind the warning. We've written up what we checked and what it means for anyone still on it, including how to migrate off a tool that's gone dark.
Local Viking is presenting as Local Optics. Its pricing page renders under that name as of 2 August 2026, while the marketing site still says LocalViking. Published plans run $39 to $200 per month, metered in credits.
So one of the two is out, and the real work is picking from the rest of the field. Here's how.
The Six Variables That Actually Differentiate Grid Tools
1. Grid size — how many points get sampled
A grid is just a set of coordinates around your business, each one running the same search independently. A 5×5 grid is 25 searches. A 15×15 is 225. A 21×21 is 441.
Bigger grids give you finer resolution and cost proportionally more to run — which is why every credit-metered tool prices by grid size, and why the tools quote their maximums prominently. BrightLocal's Local Search Grid lists sizes up to 21×21; Local Falcon's published range runs 3×3 to 17×17.
The instinct is to buy the biggest grid available. Usually wrong. A 5×5 run weekly tells you more than a 15×15 run once a quarter, because what you're looking for is movement over time, not a single high-resolution photograph.
2. Grid spacing — the variable nobody advertises
This is the one that quietly ruins comparisons.
A 7×7 grid says nothing about the area it covers. Spread across two miles, it's a dense read of a single neighbourhood. Spread across twenty, each pin is three miles from its neighbour and you're sampling a metro area at low resolution. Same grid size, completely different measurement — and the two are not comparable, even inside the same tool.
Whatever you buy, fix your spacing early and don't change it, because your ranking's real reach is what you're trying to observe and you can't observe a trend through a moving instrument. If a tool doesn't let you control spacing independently of size, that's a genuine limitation worth knowing before you buy.
3. Scan frequency — and what it costs you
Two models exist and they behave completely differently.
Scheduled tracking runs automatically at an interval and builds history without you doing anything. Scan-on-demand runs when you press the button, which is more flexible and much easier to forget to do.
The interaction with pricing is the thing to watch. Under per-location billing, frequency is free — once a location is on the plan, scanning weekly instead of monthly costs nothing extra. Under credit billing, frequency is the main thing you're buying, and doubling your cadence doubles your consumption.
4. The metering unit — the biggest cost variable in the category
Three incompatible models are in circulation:
- Per location — BrightLocal, Whitespark. Cost scales with how many businesses you track. Predictable, frequency-blind.
- Per report or credit — Local Falcon. Cost scales with how often and how finely you look.
- Per credit pair — Local Viking/Local Optics, which splits keyword credits and GeoGrid credits into separate pools that don't share. You can run dry on one while the other sits full.
Headline monthly prices across these three models are not comparable, because they don't share a denominator. Work out your own usage — locations, keywords, scans per month, grid size — and price each model against that. The cheapest-looking tool frequently isn't, and occasionally by a wide margin. We've laid out the three models and who each one suits in more detail.
5. What the tool does with the pins
A grid produces dozens or hundreds of individual positions. Every tool then compresses that into a summary number so you have something to track — an average rank, a share of visibility, a coverage percentage.
Those summary metrics are proprietary and not comparable between tools. A "visibility score" of 42 in one product means nothing in another. More importantly, a single summary number reintroduces exactly the problem the grid was meant to solve: one rank number lies, and averaging 225 pins into one figure can hide a red zone on one side of your service area completely.
Use the summary for trend direction. Read the map for decisions.
6. Whether history is retained — and exportable
The whole value of tracking is comparison over time, so ask two questions before subscribing: how long does the tool keep scan history, and can you export it?
The second one matters more than it sounds. Vendors in this category do disappear — the first half of this article is a case study in that — and if your only copy of eighteen months of ranking history lives in someone else's dashboard, you're one lapsed certificate away from losing it. Export on a schedule regardless of how established the vendor looks.
How to Actually Shortlist

Answer four questions and the field narrows fast.
How many locations? One or two, and per-location pricing is simple and cheap. Twenty or more, and credit models often win — you're not paying twelve monthly fees for something you open quarterly.
How often will you really look? Be honest, not aspirational. Frequent checking favours per-location; occasional deep audits favour per-report.
Do you need anything besides the grid? Listings management, review monitoring, GBP posting, client reporting — every one of those pushes you toward a suite and away from a measurement tool. If the grid is genuinely all you want, buying a platform means paying for five things you won't open.
Are you presenting this to someone? Agencies need white-label reporting and that requirement often overrides everything above it. If the output has to carry a client's logo, start from the tools that do that well.
Our comparison of local rank trackers works through the specific products against these criteria, including where we fit — we're building in this category and we say so on every page.
Six Variables, Not Two Brands
The reason this particular comparison is hard to find a straight answer to is that it isn't really a comparison. One of the two products can't be reached, the other has changed the name on its pricing page, and Google itself reads the query as a request for the category rather than the pairing.
Which is fine, because the category question is the more useful one anyway. Grid size, spacing, frequency, metering unit, aggregation method, history retention — those six variables will tell you more about whether a tool fits than any feature table, and they're stable enough to still be true when the price lists change.
Sort your own answers to those six first. Then look at products, and you'll find the shortlist writes itself.
One disclosure, since we've been recommending how to judge tools in a category we're entering: RankMap is building a GeoGrid tracker and we're pre-launch. We're not asking you to wait for us — you have a decision to make now. But if this is the layer you're trying to get right, join the early-access waitlist and we'll show you what we've built when it's ready.
Frequently asked questions
- 01Is Geomapy still working?
- Not through its website. As of 2 August 2026 its certificate has been expired since 16 March 2026, browsers block the page, and the server returns an empty redirect loop behind the warning. We can't speak to the company's status — only that there's no working route to the product from its own domain.
- 02What is Local Viking called now?
- Its pricing page renders as Local Optics as of 2 August 2026, while the marketing site still uses LocalViking. We can't tell from outside whether that's a completed rebrand or a partial one. Expect both names.
- 03What grid size should I use?
- Start smaller and scan more often rather than the reverse. A 5×5 or 7×7 run weekly builds a trend line; a 15×15 run quarterly gives you four disconnected snapshots. Increase size once you know which part of your service area you actually need resolution on.
- 04How often should I run a grid scan?
- Weekly for active campaigns, monthly for maintenance. More often than weekly is mostly noise — [map results fluctuate day to day](https://getrankonmap.com/blog/daily-vs-periodic-map-rank-tracking) for reasons that have nothing to do with anything you did.
- 05Are geo-grid tools worth it for a single-location business?
- Yes, and arguably more than for a multi-location one. A single business has exactly one service area, and knowing which parts of it you're invisible in is directly actionable. The catch is that a single location is where suite pricing looks least justifiable, so buy the measurement tool rather than the platform.
- 06Can I do this for free?
- For a one-off look, partly — our guide to [free Google Maps rank checking](https://getrankonmap.com/blog/free-google-maps-rank-checker) covers what genuinely exists. You won't get tracked history, and history is the entire point. Grid scanning at volume costs real money to run, which is why nobody gives it away indefinitely.
Explore with AI
Share this
Map your real rank across the city.
Free for the first 50 scans. No credit card.
Join the waitlist

