What Is GeoGrid Rank Tracking? A Plain-English Guide
GeoGrid rank tracking measures your Google Maps position across a grid of points near you, then plots it as a red-yellow-green map of where you rank.
GeoGrid in One Screen
-
GeoGrid rank tracking checks your Google Maps rank from a grid of geographic points spread across your service area — not from one location — and plots the result as a colour-coded heatmap
-
It exists because of how Google ranks local results: distance from the searcher is one of Google's three official ranking factors, so your position genuinely changes from block to block
-
A scan runs your keyword from every point on the grid, records your rank at each, and colours it — green for top-three, yellow for mid-pack, red for not ranking
-
The output is not a number, it is a picture: the green core around your address, the red edges where competitors own the neighbourhoods, the yellow battleground in between
-
It is the named, visual form of advice the industry already gives — Neil Patel tells businesses to track "within a specific radius." A GeoGrid is what that actually looks like
-
It matters most for multi-location brands, service-area businesses, and agencies — anyone whose customers are spread across an area, and anyone who has to prove their local SEO actually moved the map
"Where do you rank on Google Maps?" sounds like a question with one answer. It isn't — and GeoGrid rank tracking is the method built around that fact. It's a term you'll see across local SEO tools without anyone stopping to define it properly, so here is the plain-English version: what it is, how a scan actually works, and why it shows you something a single rank number is structurally incapable of showing.
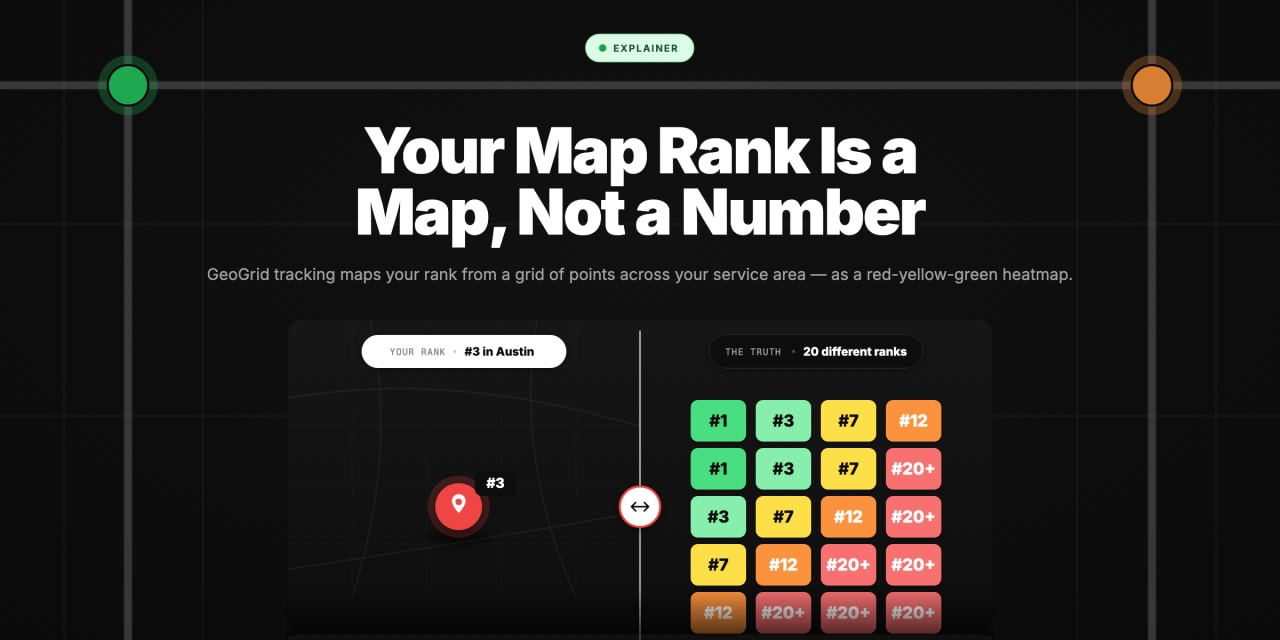
If you take one idea from this page, take this one: your Google Maps rank is not a number. It's a map. GeoGrid tracking is simply how you see that map instead of guessing at it from a single spot.
The Trick Question: Where Do You Rank on Google Maps?
Ask any local business owner where they rank and you'll get one number — "we're third for our main keyword." It feels like a fact. It's actually a single sample from one location, and the real answer is different on every block. Understanding why is the whole reason GeoGrid tracking exists, so it's worth thirty seconds before we define the term.
Search "dentist near me" from the street outside a practice and you might see them at #1. Run the identical search from a neighbourhood ten minutes away and they can be off the map entirely — beaten by three competitors who are simply closer to that searcher. Same business, same keyword, same minute, completely different result.
That isn't a glitch. It's by design. Google has openly stated how it ranks local results: three factors — relevance, distance, and prominence. Relevance is how well you match the search; prominence is how well-known and reviewed you are. But the middle one, distance, is the one that breaks the single-number habit completely. Google weighs how far each business is from the person searching. Move the searcher, and the ranking moves with them.
So "where do you rank on Google Maps?" has no single answer — it has a different answer at every point your customers might search from. (We pull this apart in detail in our piece on why one rank number lies; here it's enough to know the answer is a map, not a number.) The question is which method you use to see all of those answers at once. That method is the GeoGrid.
What GeoGrid Rank Tracking Actually Is
Here is the definition, stripped of jargon. GeoGrid rank tracking lays a grid of points over the area you serve, runs your keyword from each one, and records your rank at every point — then plots the whole thing on a map and colours it by position. Instead of one number from one place, you get a picture of your visibility across real geography.
GeoGrid rank tracking measures your local search ranking from a grid of geographic points spread across your service area, rather than from a single location. That's the whole idea, and everything else is detail.
Picture a grid of pins laid over a map of your city — a tidy spread of points covering the neighbourhoods, suburbs, and streets you want customers from. At each pin, the tracker performs your search ("plumber near me," "family law firm," whatever you rank for) as if the searcher were standing on that exact spot, and records where you land in the results. Do that across the whole grid and you've measured not your rank, but your coverage — your position everywhere your customers actually are, not just where you happened to look.
The name is literal. "Geo" for geography, "grid" for the array of points. Some tools call it a geo-grid, a grid scan, or local grid tracking; it's the same thing. And it's not a fringe technique — it's the honest form of advice the industry already gives. Neil Patel tells local businesses to track "at the zip code or city level, not just the broad regional level," using hyperlocal tracking "within a specific radius." A GeoGrid is exactly that instruction, drawn on a map.
How a GeoGrid Scan Works, Step by Step
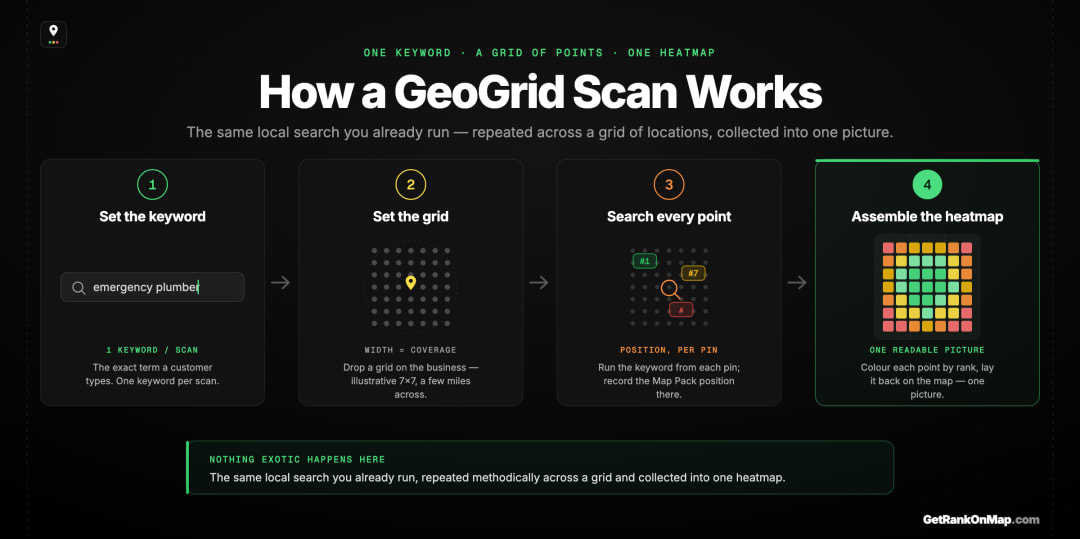
A scan has four moving parts: the keyword you want to rank for, the grid of points around your business, the search run at each point, and the heatmap that comes out the other side. None of it is complicated once you see the sequence — it's the same search you'd run by hand, repeated across dozens of locations and collected into one view.
Under the hood, a GeoGrid scan is just one search you already understand, repeated methodically across geography. Here's the sequence:
-
You set the keyword. Pick the search term you want to be found for — the one your customers actually type, like "emergency plumber" or "pediatric dentist." One scan tracks one keyword (most tools let you run several in parallel).
-
You set the grid. Drop a grid centred on your business — say a 7×7 array of points covering a few miles in every direction. You control how wide the grid spreads and how many points it uses; a wider grid covers more of your service area, a denser grid shows finer detail.
-
The tracker searches from every point. At each pin, the tool runs your keyword as if a searcher were physically standing there, and records your Map Pack position at that location — #1, #7, or nowhere. Dozens of real local searches, one per grid point.
-
The results become a heatmap. Every point gets coloured by your rank there, and the colours are laid back over the map. What was a list of positions becomes a single picture of where you win and where you vanish.
The output isn't a spreadsheet you have to interpret — it's a map you can read in a glance. Which brings us to the part that does the real work.
Reading the Heatmap: Green, Yellow, Red
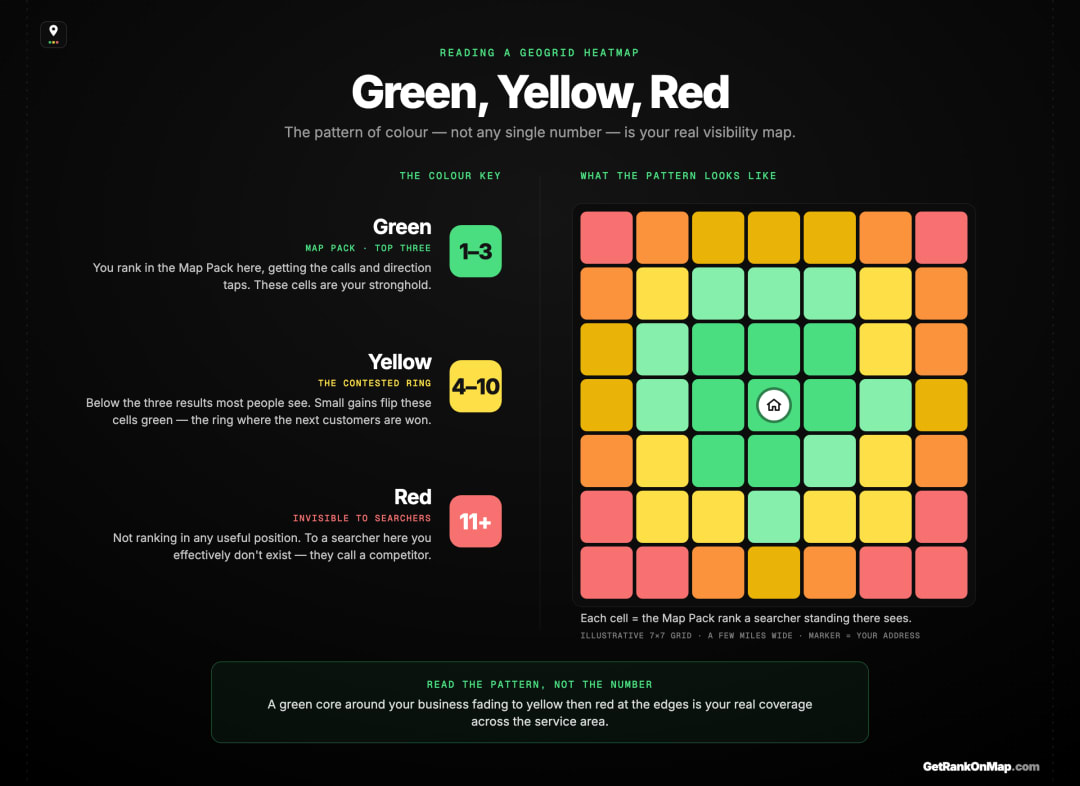
The heatmap is the payoff, and it's designed to be understood instantly. Each grid point is coloured by your ranking there — green where you're top-three and showing in the pack, yellow where you're mid-pack and slipping, red where you're invisible. The pattern those colours make tells you more in one look than a year of single-number reports.
The whole point of a GeoGrid is that you don't need to read numbers — you read colour. The convention is simple and consistent:
-
Green — you rank in the top three here. You're in the Map Pack, getting the calls and the direction taps. This is your stronghold.
-
Yellow — you're mid-pack, somewhere in the rankings but below the three results most people ever see. You're close, and small improvements here flip cells green.
-
Red — you're not ranking in any meaningful position. To a searcher standing here, you effectively don't exist; they're calling a competitor.
Laid across the grid, those colours form a shape, and the shape is the insight. Almost every local business shows a green core around its own address that fades to yellow further out and red at the edges — the neighbourhoods where competitors are simply closer or stronger. That gradient is your real visibility. The green tells you where you're safe. The red tells you which neighbourhoods you're handing to competitors. And the yellow — the contested middle ring — is usually where the winnable customers are, because small gains there turn directly into pack placements. A single rank number describes one pixel of this picture and hides all the rest.
GeoGrid Tracking vs. a Traditional Rank Tracker
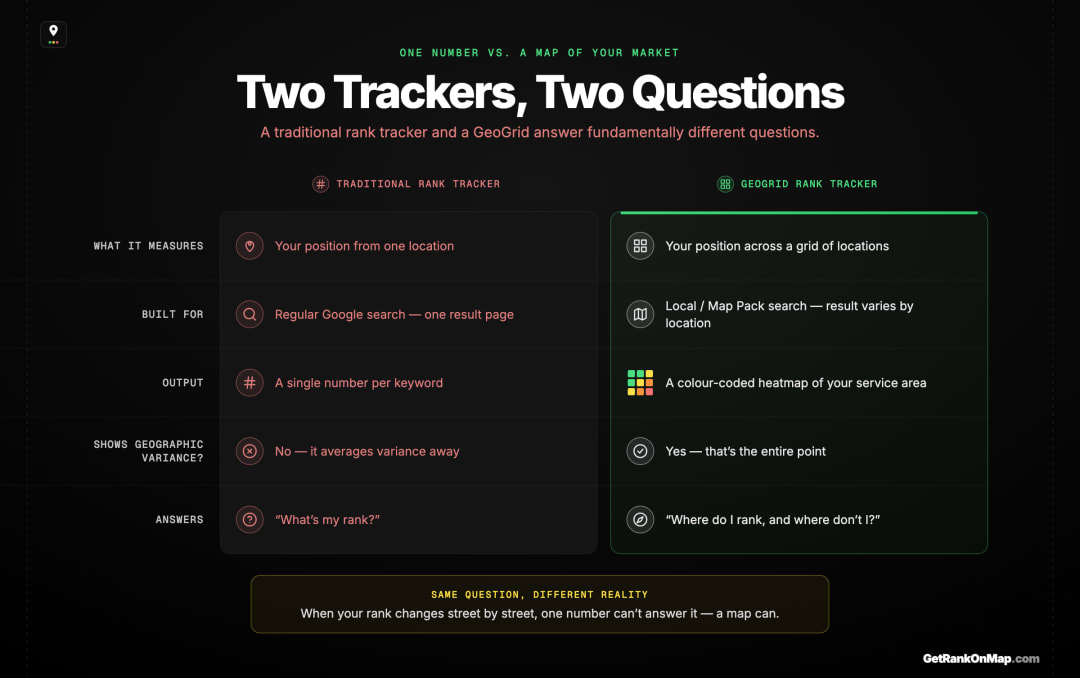
Most rank trackers were built for regular Google search, where there's one results page for a query and one position to record. Local search doesn't work that way — there's a different result for every location — so a traditional tracker, pointed at the Map Pack, measures one spot and calls it your rank. The difference between the two isn't accuracy; it's whether you're measuring a point or an area.
It's worth being precise about what GeoGrid tracking replaces, because "rank tracker" covers two very different things:
| Traditional rank tracker | GeoGrid rank tracker | |
|---|---|---|
| What it measures | Your position from one location | Your position across a grid of locations |
| Built for | Regular Google search (one result page) | Local / Map Pack search (result varies by location) |
| Output | A single number per keyword | A colour-coded heatmap of your service area |
| Shows geographic variance? | No — averages it away | Yes — that's the entire point |
| Answers | "What's my rank?" | "Where do I rank, and where don't I?" |
A traditional rank tracker isn't wrong — it's just answering a question that has a single answer (your position in normal web results) using a method that breaks the moment the answer becomes location-dependent. Point it at the Map Pack and it dutifully reports one number from one spot, which is exactly the trap. GeoGrid tracking is built for the reality that local rankings are plural. It doesn't give you a better number; it gives you the map the number was always hiding.
Who Actually Needs GeoGrid Rank Tracking
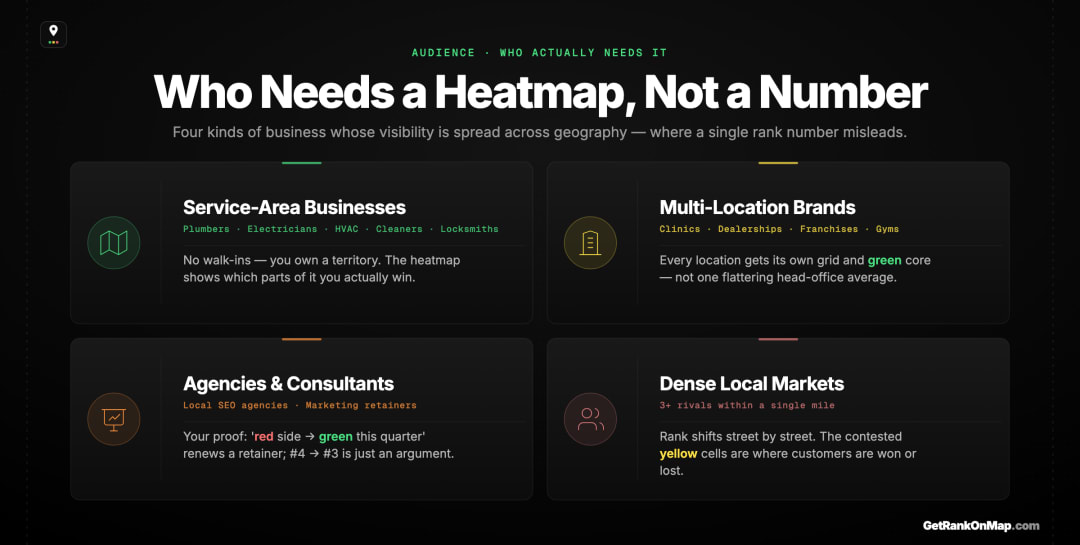
Not every business needs to see its rankings as a map, but the ones that do, need it badly. If your customers are spread across an area, if you serve more than one location, or if you're paying someone to improve your local SEO, a single rank number is actively misleading you — and a heatmap is the only honest way to see what's really happening.
GeoGrid tracking earns its keep for anyone whose visibility is spread across geography rather than concentrated in one spot:
-
Service-area businesses — plumbers, electricians, HVAC, cleaners, locksmiths. You don't have walk-in customers; you have a territory, and a heatmap is the only way to see which parts of it you actually own.
-
Multi-location brands — clinics, dealerships, franchises, gyms. Each location has its own grid and its own green core, and head-office needs to see all of them, not an average that flatters the strong branches and hides the weak ones.
-
Agencies and consultants — when you're paid to improve a client's local rankings, a heatmap is your proof. "You went from a red south side to a green one this quarter" is a renewal. A single number that drifted from #4 to #3 is an argument.
-
Anyone competing in a dense local market — if three competitors sit within a mile of you, your rank genuinely changes street by street, and the contested yellow cells between you are where the next customers are won or lost.
If your business has one location and your customers all come from the few blocks around it, a single rank check from your front door is almost honest. For everyone else — which is most local businesses — the map is the only version of the truth that isn't a flattering selfie.
See Your Business as a Heatmap
That's GeoGrid rank tracking: a grid of points across your service area, one search at each, and a red-yellow-green map of where you actually win and lose — the honest form of "track within a specific radius," drawn so you can read it in seconds.
That's exactly what RankMap is built to do. Set your keyword, drop a grid over your service area, and get back a heatmap of your real Map Pack coverage — your colours and your competitors' side by side, refreshed on a schedule, with no dozens of incognito searches by hand.
RankMap isn't live yet — we're pre-launch. If you want to stop guessing at a single number and see your business the way your customers' searches really see it, join the waitlist for early access. No pretending we're something we're not; just first in line the day the map is ready.
The Grid Is the Measurement
This is exactly why no business ranks #1 everywhere on Google Maps — your rank changes block by block.
Once you are running grid scans, the next question is how often to track your Map Pack rank.
GeoGrid rank tracking isn't a complicated idea once you see what it's really for. Google ranks local results partly by how close each business is to the searcher, which means you don't have one Map Pack ranking — you have a different one at every point your customers might search from. A GeoGrid measures all of those points at once and draws them as a heatmap: green where you win, red where you don't, yellow where the next customers are waiting.
It's the honest answer to a trick question. "Where do you rank on Google Maps?" has no single number for an answer — it has a map. Once you've seen your business as that map, a single rank number looks like what it always was: one pixel, taken from your best angle.
That's the entire reason RankMap exists — to turn your local visibility from a misleading number into a map you can actually act on. We're not live yet, but when we are, you'll see your business exactly as your customers' searches do. Join the waitlist to be first in line.
Go deeper
Frequently asked questions
- 01What is GeoGrid rank tracking?
- GeoGrid rank tracking measures your Google Maps ranking from a grid of geographic points spread across your service area, rather than from a single location. At each point it runs your keyword and records your Map Pack position, then plots the results on a map and colour-codes them — typically green for top-three, yellow for mid-pack, red for not ranking. The output is a heatmap of your real local visibility that shows exactly where you rank well and where you're invisible, instead of one number that averages it all away.
- 02How does a GeoGrid scan work?
- You set a keyword and drop a grid of points centred on your business — for example a 7×7 array covering a few miles in each direction. The tool then runs your keyword from every point on the grid, as if a searcher were standing on that exact spot, and records your rank at each one. Those positions are coloured by rank and laid back over the map, turning dozens of individual searches into a single heatmap you can read at a glance.
- 03Why does my Google Maps ranking change by location?
- Because distance is one of the three factors Google uses to rank local results, alongside relevance and prominence. Google weighs how close each business is to the person searching, so the same keyword returns different results from different locations. This is exactly why GeoGrid tracking exists — a single rank number only describes your position at the one spot you searched from, while a grid captures how your rank changes across your whole service area.
- 04What do the colours on a GeoGrid heatmap mean?
- The standard convention is green for points where you rank in the top three (you're in the Map Pack), yellow for points where you're mid-pack but below the top results most people see, and red for points where you're not ranking in any useful position. The pattern they form — usually a green core around your address fading to red at the edges — shows your real coverage: where you're strong, where you're contested, and where competitors are winning the neighbourhoods.
- 05How is GeoGrid tracking different from a normal rank tracker?
- A normal rank tracker measures your position from one location and reports a single number per keyword — fine for regular Google search, where there's one result page. But local Map Pack results change by location, so a single-point measurement misses the geographic variance entirely. GeoGrid tracking measures across a grid of points and shows the whole pattern, answering "where do I rank?" instead of just "what's my rank?"
- 06Do I need GeoGrid tracking if I only have one location?
- If you have a single location and nearly all your customers come from the immediate area around it, a single rank check is close to honest, though even then your rank will vary across the few blocks you serve. GeoGrid tracking matters most for service-area businesses, multi-location brands, agencies proving their work, and anyone in a dense market where competitors sit within a mile and rankings genuinely change street by street.
Explore with AI
Share this
Map your real rank across the city.
Free for the first 50 scans. No credit card.
Join the waitlist